A Story in Maps
March 16, 2020
I want to tell you a story in maps to give you an idea of how we plan in a time of the most imperfect information.
Right now, we are still in reactive mode as one by one our nonprofit distribution partners announce closures. In a time of increased need, there are less and less places to go to. We are trying to wait for some level of stasis of closures so we can fully assess which of our partners can continue to distribute food.
Until we do that. We are just reacting. To the many calls we get for MORE food donations as food establishments close and events get canceled.
Our network, which we strive to keep balanced, is very much imbalanced. Increased food, increased need, decreased service sites.
We are coordinating efforts with the Food Bank. For the first time in 412 Food Rescue history, we are considering door to door delivery. What does it mean for our network? This is the test of our network that may change the way we work from hereon.
As always, I want to commend the 412 Food Rescue team, especially our field operations team. We are working with information that is incomplete and changes quickly. Everyone in the team just wants to be of service. We see our friends in the restaurant and food industry losing their jobs, worried about how to make rent, pay bills. We see our colleagues responding to critical needs, trying to balance service and safety.
It’s a firehose. And we are determined to serve as much as we can. But with the resources we have, we also need to focus. 412FR receives marginal government support and none for our core work. All our work is made possible with the partnership of our community. YOU.
So how do we focus? We began our assessment when PPS announced closures. The first thing that comes to our minds – how will kids who depend on school food eat? We were grateful when the PPS announced continued service of school meals. So the next question in our minds – how can we complement this in the most impactful way?
We asked Melinda Angeles – one of our most dedicated food rescue heroes – to help us visualize the challenge. Emily Constantine Mercurio is my constant advisor on these as well.
Here is the story in maps. Our plans change hourly as we coordinate different donors, agencies, people and encounter never before seen situations. Our work evolves and we are grateful to everyone. We keep on planning, waiting for information, and we hope to have a plan of action – not reaction – soon.
Leah Lizarondo
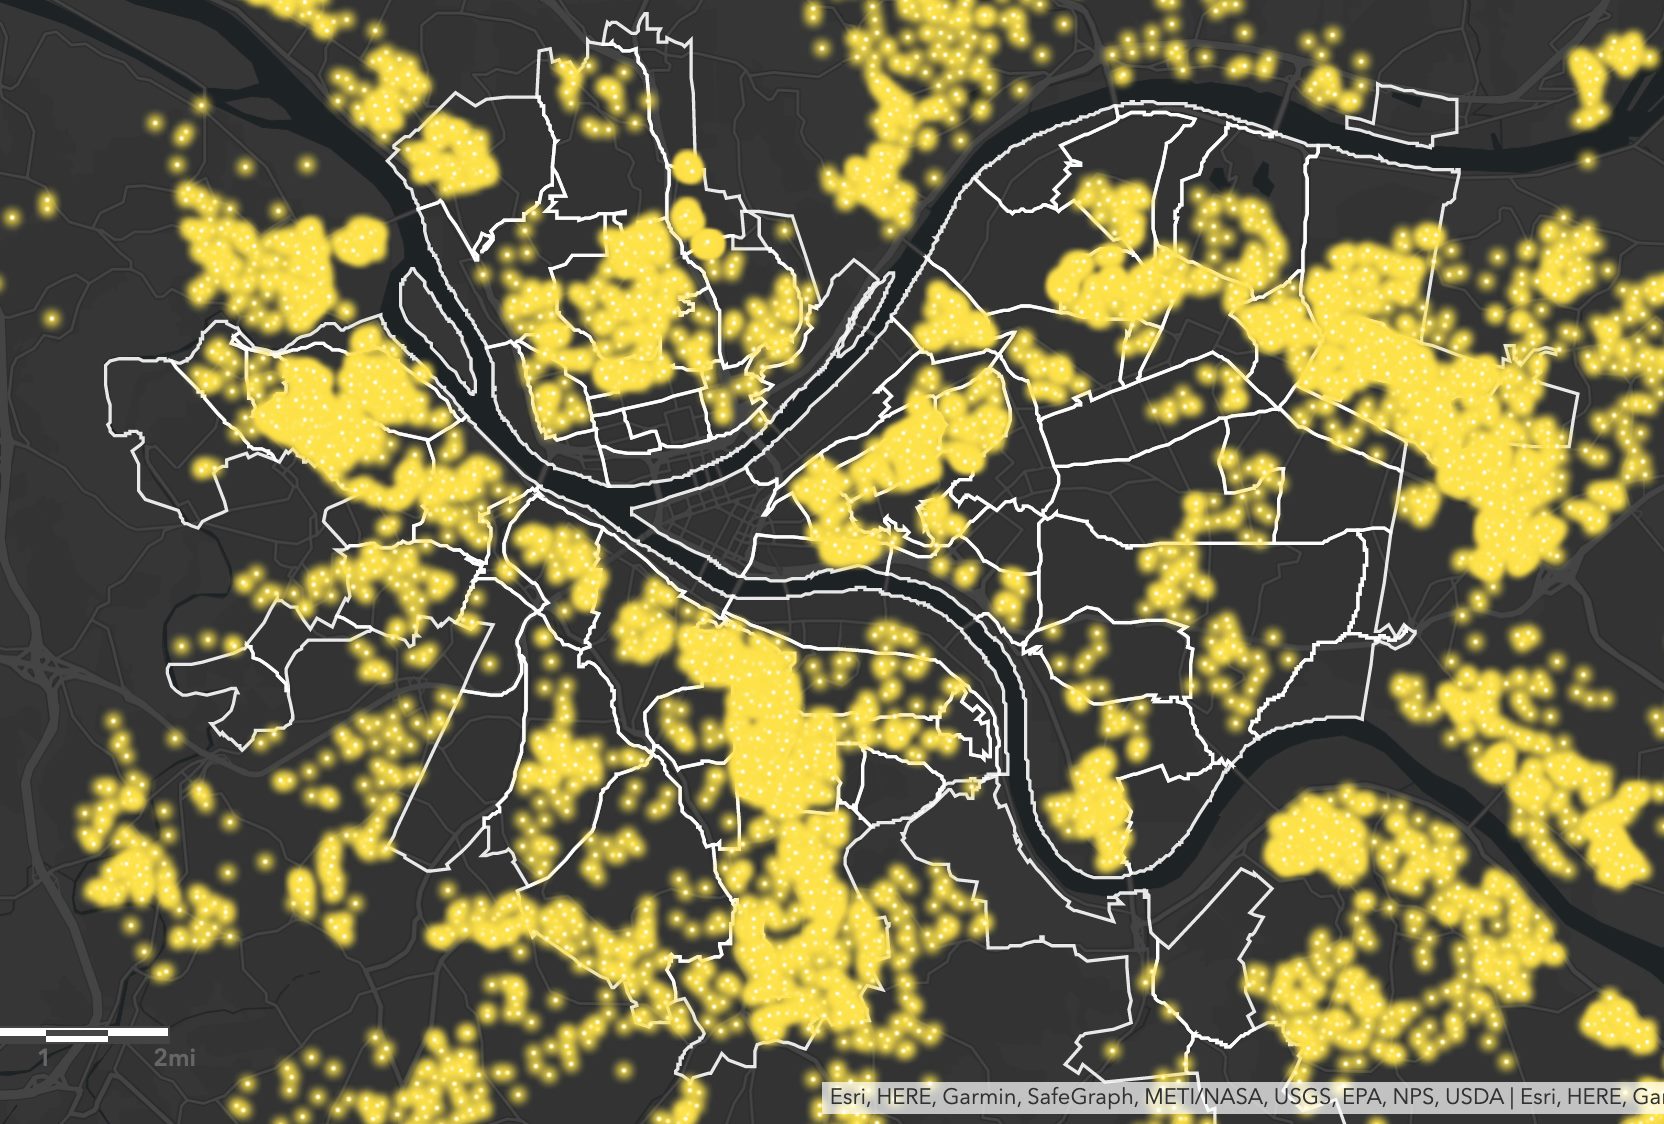
This is a map of children aged 6-11, living in poverty, in Pittsburgh. We assumed older kids can take the PAT bus (some of them already do with the reduced school bus service) to get to the schools to access food.
You can be SURE this is an underestimation of current need because living 200% above poverty means these families are still in need of support AND many families
who were not in poverty before but whose parents have lost their job because of this virus are NOW in need.
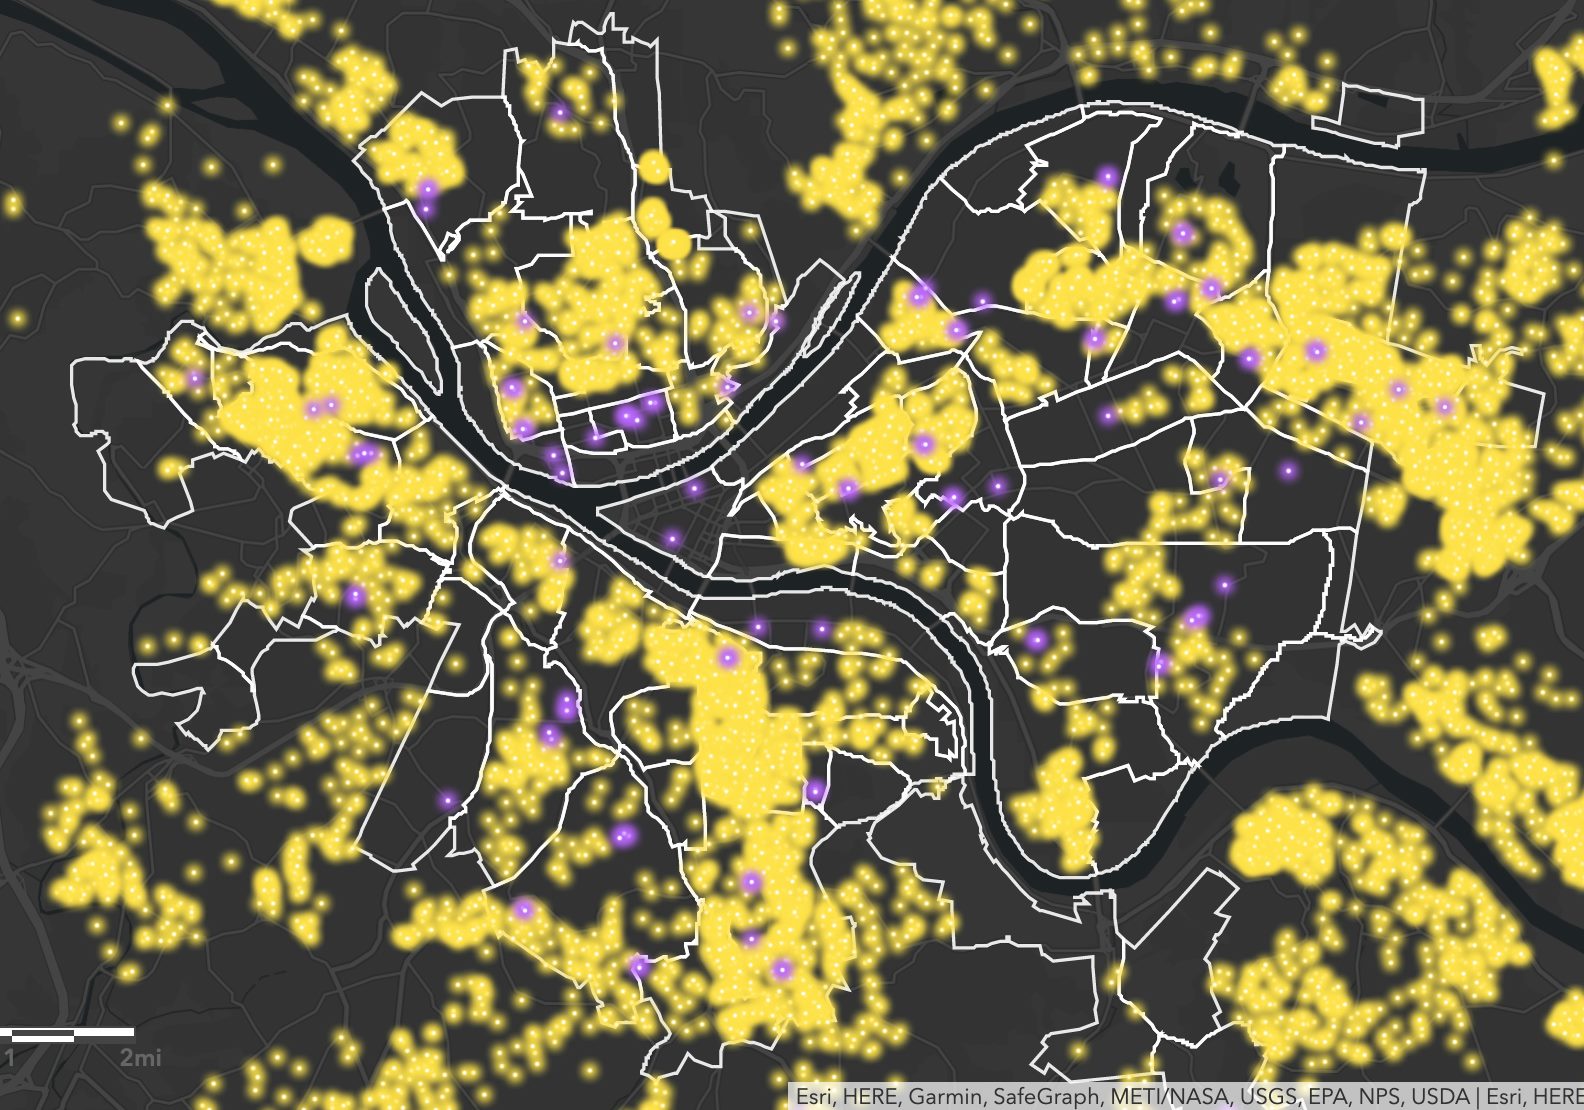
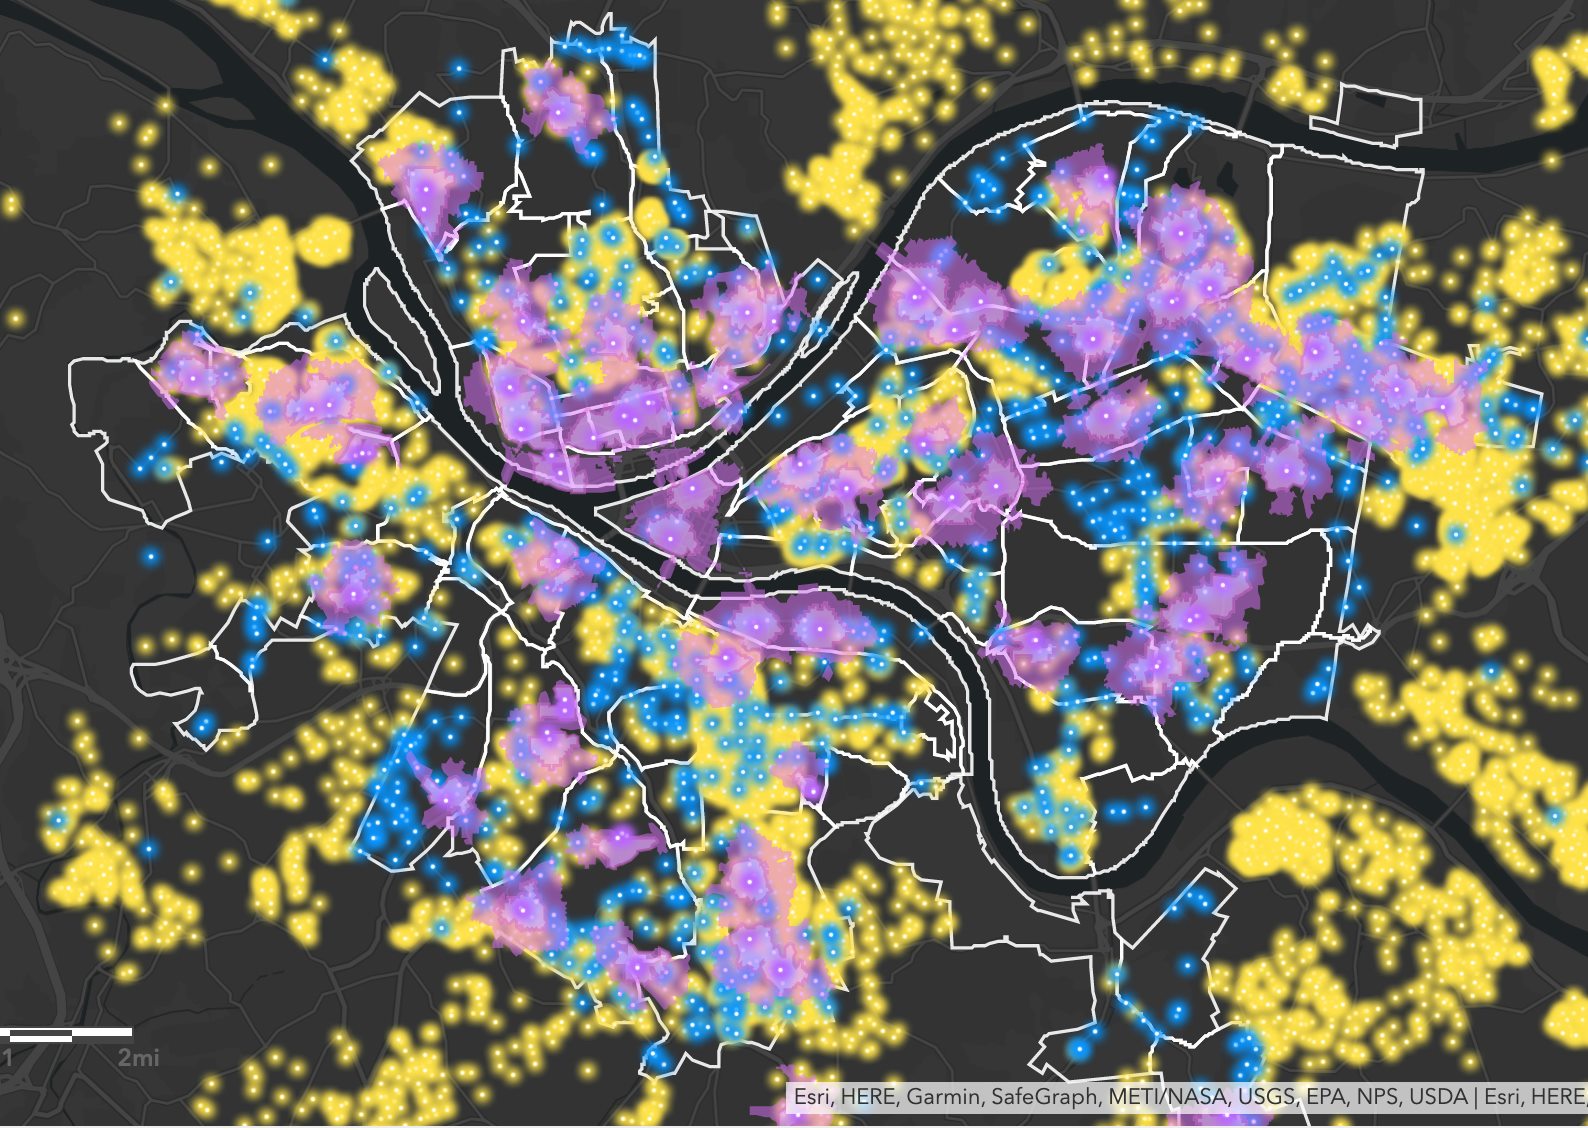
These are where the PPS schools are (purple).
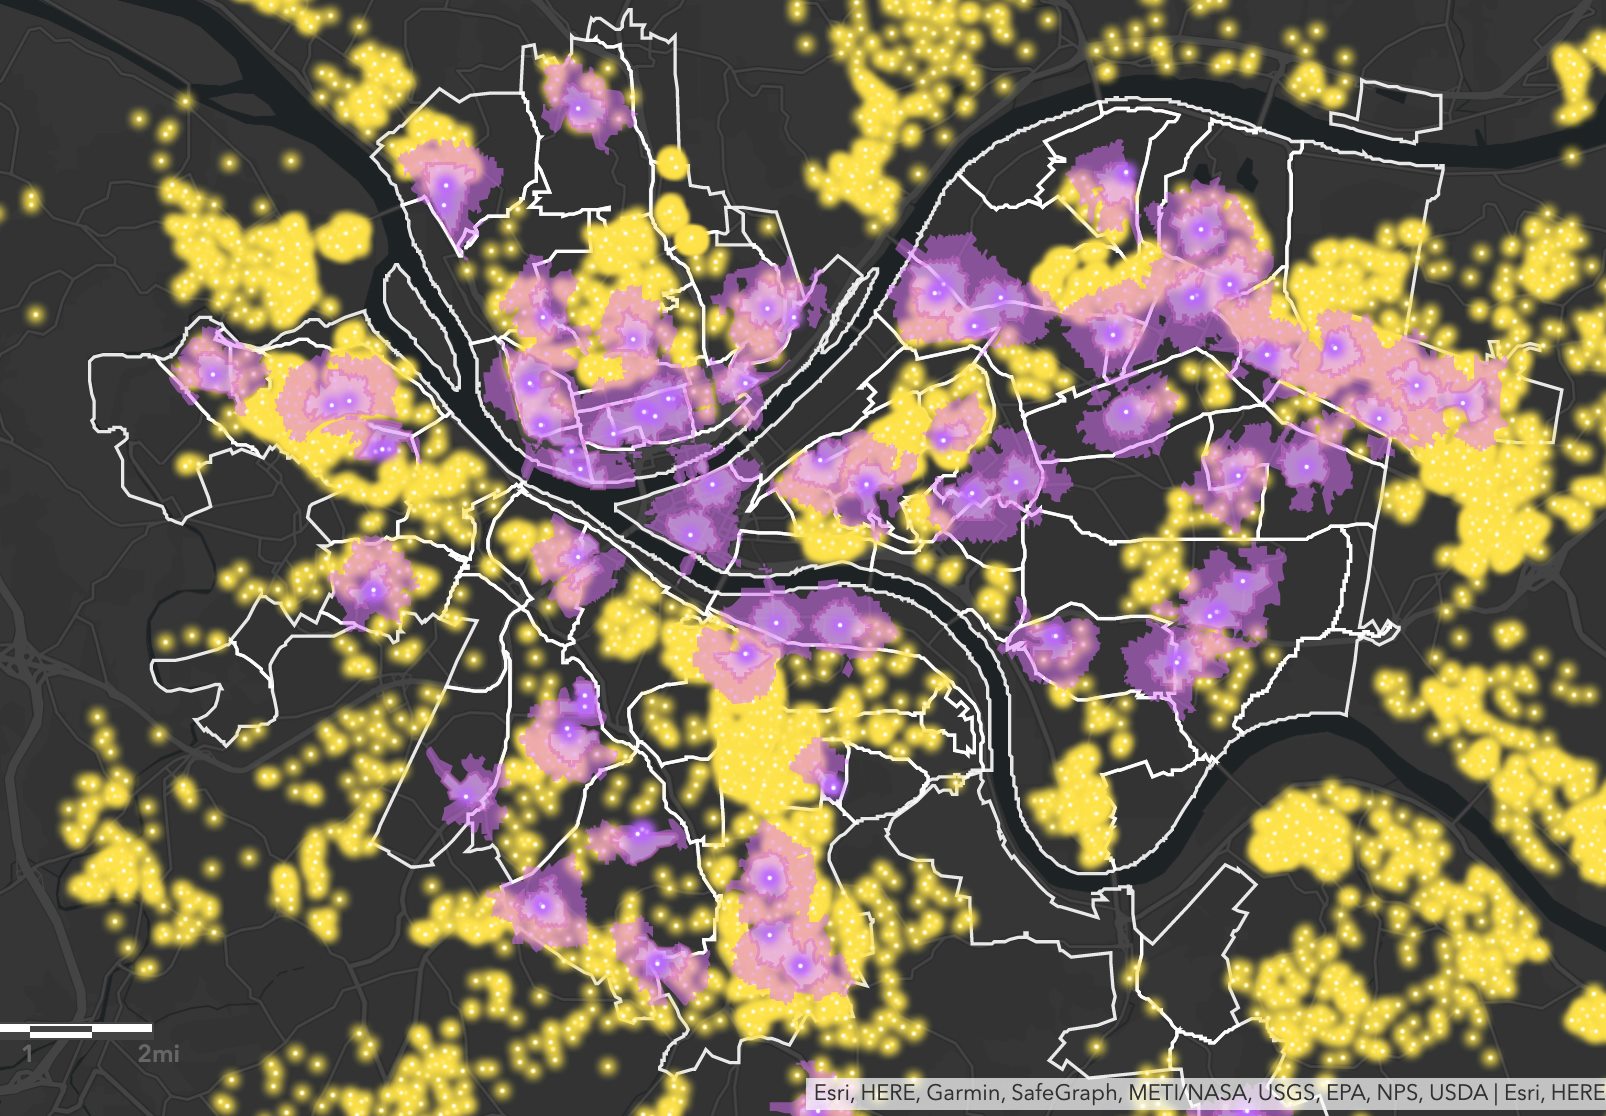
This is the .25 mile and .5 mile “walk shed” – area that is within half a mile of a PPS. Why half mile? I am imagining if my 7 year old needs to walk with maybe an older sibling. Over hills. So now we see which areas have most need.
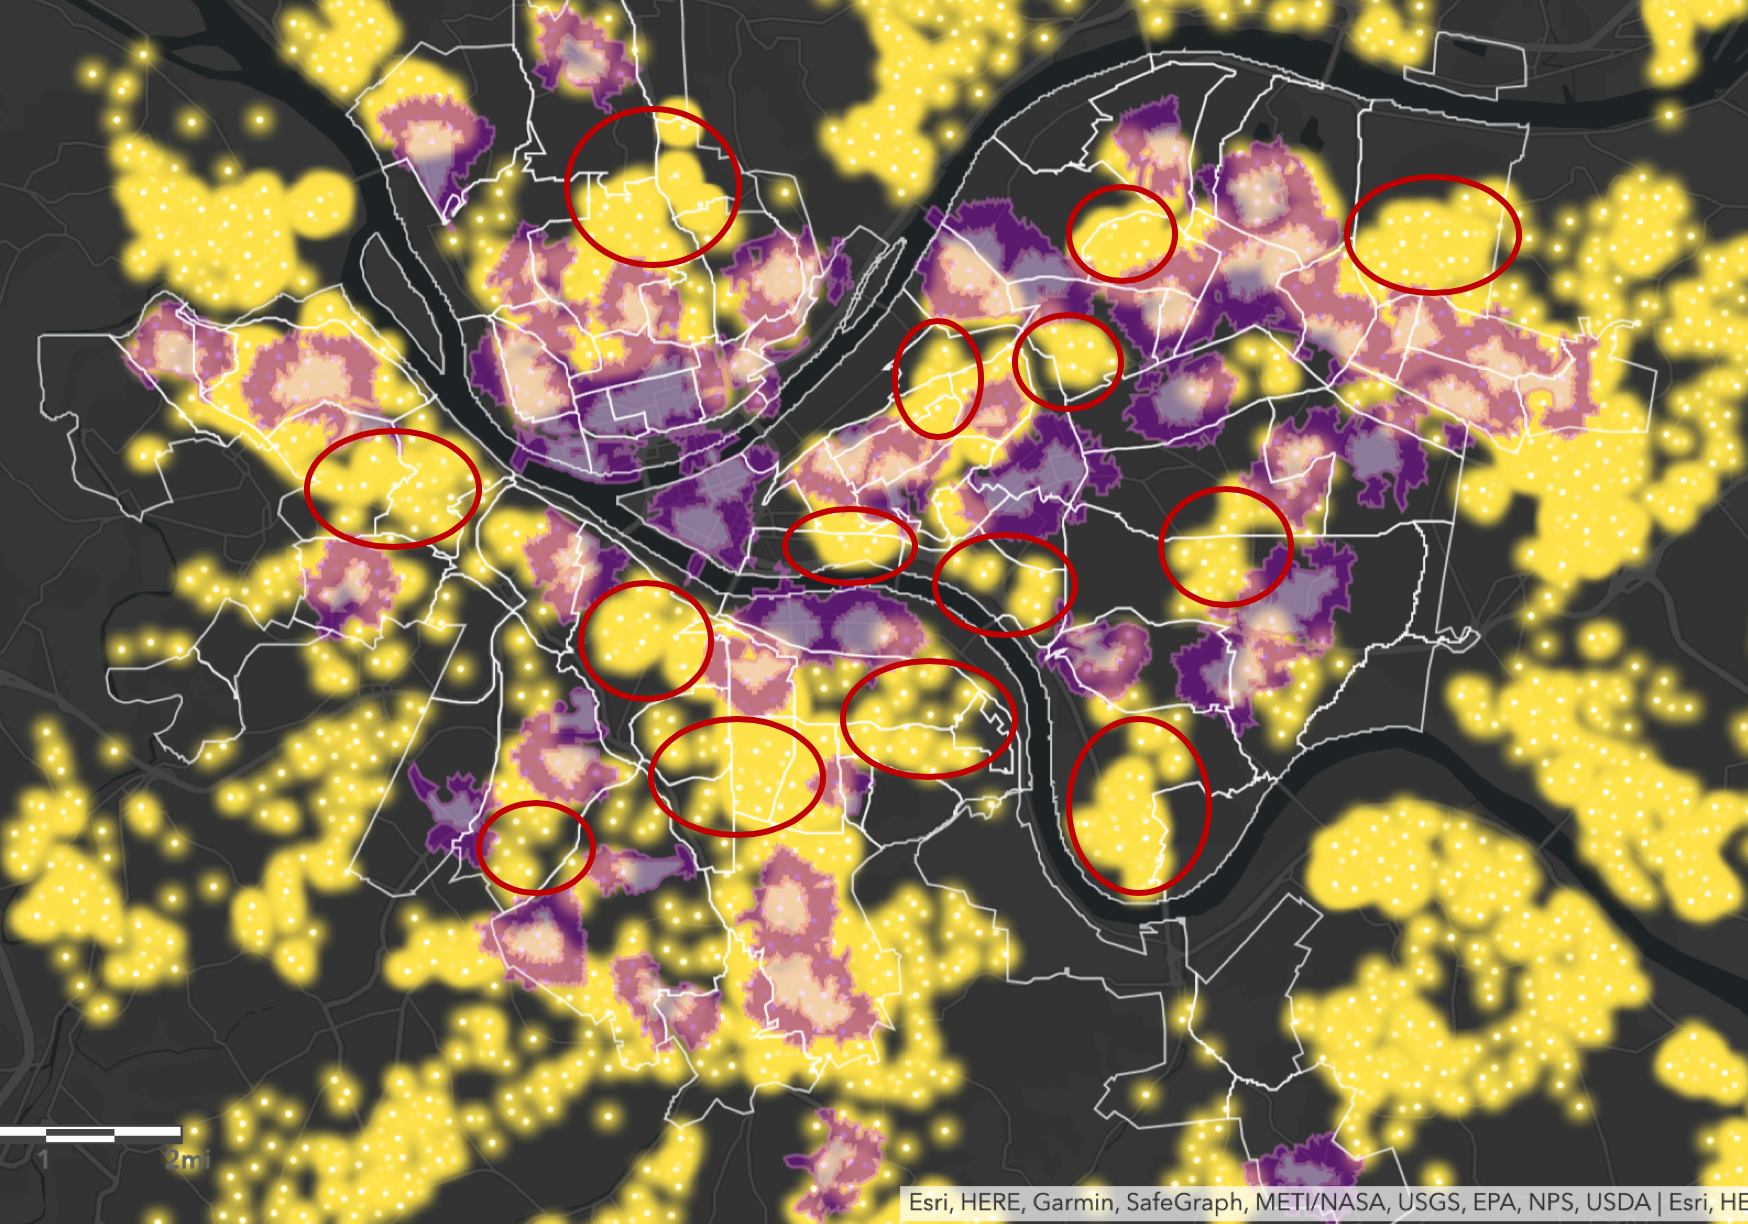
So now we see which areas have most need. We don’t even circle them all.
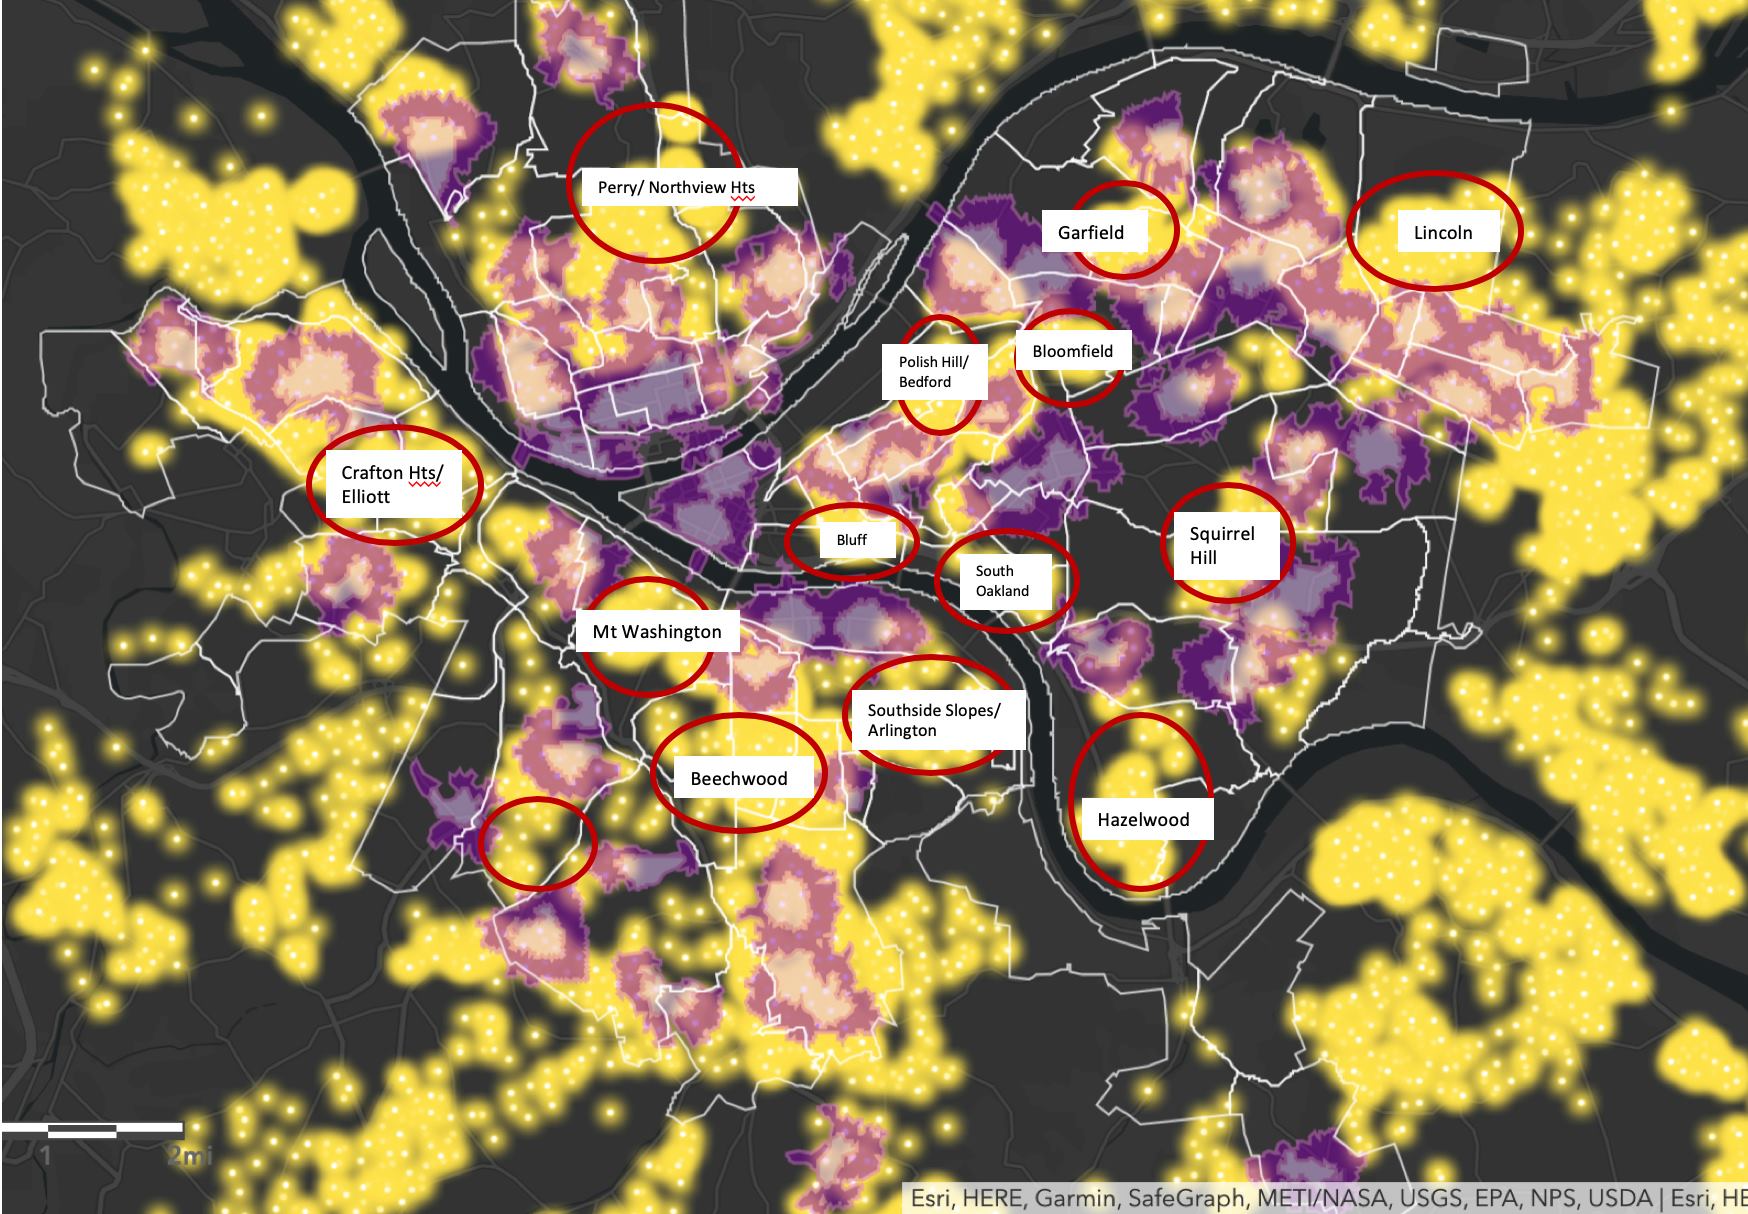
Here they are marked and labeled. What we are doing is now looking at nonprofit partners in these areas to see if they would distribute excess food from the PPS after their lunch service, so kids in these areas can walk to an alternate location.
We are even looking at PPS bus stops (blue). Here they are – look how the areas that are in need are covered. Can we activate them?